


Table of Contents
- Group Core Business Profit After Tax of LKR 1.8 Bn
- Group Total Capital Adequacy Ratio of 16.092%
- Group Net Fee and Commission Income up by 34% to LKR 1.9 Bn
- Group Total Assets up by 3% to LKR 885 Bn
DFCC Bank delivered a strong financial performance for the period ended 31 March 2026, underscoring the robustness of its strategy, disciplined execution, and the resilience of its balance sheet. Loan and deposit portfolios recorded sustained growth of 5% and 7%, respectively, compared to 31 December 2025, reflecting calibrated credit expansion and funding optimisation. As a result, total assets increased by 3% to LKR 884 Bn and total liabilities grew by 4% to LKR 777 Bn.
Prudent liquidity management and funding optimisation, together with effective control of funding costs in a moderating interest rate environment, supported the Bank’s performance and strengthened long-term value creation for shareholders and customers, resulting in a 12% increase in Net Interest Income to LKR 8 Bn.
Profit After Tax from core business amounted to LKR 1.7 Bn, reflecting the Bank’s prudent and forward-looking approach to risk management amid evolving geopolitical and macroeconomic conditions. During the period, the Bank strengthened impairment provisioning through updated model calibrations and management overlays, while adopting selective lending strategies and disciplined cost management measures to support sustainable growth and strengthen resilience against unforeseen external shocks. Consequently, impairment charges increased by LKR 1.8 Bn compared to the corresponding period.

Advancing its strategic priorities to strengthen its retail and wealth franchise, broaden its customer base, and accelerate scale across key growth segments, DFCC Bank achieved a significant milestone with the signing of a binding Business Sale Agreement with Standard Chartered Bank PLC to acquire its Wealth and Retail Banking operations in Sri Lanka. The Bank has now transitioned to the next phase of the transaction, with integration and migration activities currently underway as the Bank progresses towards completion of the transition.
The following commentary relates to the unaudited financial statements for the period ended 31 March 2026, presented in accordance with Sri Lanka Accounting Standard 34 (LKAS 34) on Interim Financial Statements.
INCOME STATEMENT ANALYSIS PROFITABILITY
DFCC Bank PLC, the largest entity within the Group, reported a Profit Before Tax (PBT) of LKR 2,439 Mn and a Profit After Tax (PAT) of LKR 1,715 Mn from core operations for the period ended 31 March 2026, compared to a PBT of LKR 3,962 Mn and a PAT of LKR 2,818 Mn in the corresponding period.
At Group level, for the period ended 31 March 2026, Profit Before Tax was LKR 2,573 Mn and Profit After Tax was LKR 1,812 Mn, compared to LKR 4,105 Mn and LKR 2,927 Mn, respectively, in 2025. The Bank’s Earnings Per Share (EPS) from core banking operations was LKR 3.90 for the period ended 31 March 2026.
The Bank’s Return on Assets (ROA) before tax was 0.56%, while Return on Equity (ROE) after tax stood at 4.40% for the period ended 31 March 2026.
The Bank’s total tax expense, including Value Added Tax (VAT), Social Security Contribution Levy (SSCL) on financial services, and Income Tax, amounted to LKR 1,706 Mn for the period ended 31 March 2026. Consequently, the Bank’s tax expense as a percentage of operating profit stood at 50% for the period.
NET INTEREST INCOME
For the period ended 31 March 2026, interest income and interest expense grew by 15% and 17%, respectively, resulting in a 12% increase in net interest income to LKR 8,323 Mn. This performance reflects disciplined margin management in a lower interest rate environment compared to the prior period, alongside a 16% expansion of the Bank’s asset base over the past 12 months. The 31% growth in the loan portfolio further supported performance, driven by effective loan book expansion, funding cost optimisation, and a strategic focus on high-quality asset growth, compared to 31 March 2025.
In addition, the CASA portfolio increased by 6% from 31 December 2025, with the CASA ratio improving to 24.20% as at 31 March 2026, indicating a stronger deposit mix and improved cost efficiency. Net Interest Margin was maintained at 3.88 % in March 2026, compared to 3.96% in December 2025, reflecting competitive pressures and prevailing market dynamics.
FEE AND COMMISSION INCOME
Strategic focus on trade-related commissions and card-based services supported strong growth in fee based income, with the credit card portfolio expansion contributing significantly to overall performance.
While related fee expenses increased in line with customer acquisition and portfolio growth, the net impact remained positive. Net fee and commission income increased by 34% to LKR 1,916 Mn, compared to LKR 1,434 Mn in the corresponding period in 2025.
NET (LOSSES)/ GAINS FROM TRADING
The Bank’s reported bottom line for the period was impacted by mark-to-market valuation losses on equity securities, arising from heightened volatility in global financial markets amid ongoing geopolitical developments, including the escalation of the Middle East conflict, which negatively impacted investor sentiment and equity market valuations globally.
Consequently, an unrealised loss of LKR 569 Mn on equity investments was recognised in the income statement. This temporary impact reflects short-term market fluctuations and does not indicate any deterioration in the quality of the Bank’s investment portfolio or its long-term strategic positioning.
IMPAIRMENT CHARGE ON LOANS AND OTHER LOSSES
The Stage 3 impaired loan ratio improved to 4.18% as at 31 March 2026, from 4.55% as at 31 December 2025, supported by recoveries and portfolio expansion.
In response to current and potential future impacts of global and domestic economic conditions on the Bank’s lending portfolio, management strengthened impairment provisioning during the period. This was achieved through enhancements to internal expected credit loss models to capture risk factors not fully observable in the current volatile geopolitical and economic environment, including the recognition of additional provisions as management overlays for exposures to higher-risk sectors and customer segments.
The Bank also maintained adequate provisioning in line with the accelerated growth in its lending portfolio. As a result, impairment charges increased to LKR 3,163 Mn for the period ended 31 March 2026, compared to LKR 1,355 Mn recorded in the corresponding period of 2025. These provisions have been established to safeguard the Bank’s financial strength and reflect a more conservative assessment of potential credit risks, taking into account prevailing macroeconomic conditions and the potential impact of the geopolitical environment.
OPERATING EXPENSES
Technology and digital transformation remained central to the Bank’s strategy, with continued investments in IT infrastructure aimed at enhancing multi-channel service delivery, strengthening information security, and improving operational efficiency. At the same time, increased investment in marketing and promotional initiatives supported brand visibility, deeper customer engagement, and product growth. Together, these initiatives are expected to generate long-term value by reinforcing brand equity, broadening market presence, accelerating customer acquisition, and strengthening DFCC Bank’s competitive standing in a dynamic financial environment.
As a result of these strategic investments, operating expenses increased to LKR 5,278 Mn for the period ended 31 March 2026, compared to LKR 4,329 Mn in the corresponding period of 2025. The Bank continues to prioritise cost optimisation to ensure sustainable growth and operational resilience.
OTHER COMPREHENSIVE INCOME (OCI)
Changes in the fair value of investments in equity and fixed-income securities (treasury bills and bonds), along with movements in hedging reserves, are recorded through other comprehensive income. The application of hedge accounting minimised the impact of exchange rate fluctuations on the Bank’s profitability.
A fair value gain of LKR 388 Mn was recorded on equity investments outstanding as at 31 March 2026, primarily driven by the increase in the share price of Commercial Bank of Ceylon PLC.
FINANCIAL POSITION ANALYSIS ASSETS
Total assets increased by LKR 27 Bn, representing a 3% growth since December 2025, mainly attributable to the expansion of the loan portfolio, which rose by LKR 25 Bn to LKR 540 Bn, a 5% increase from LKR 516 Bn as at 31 December 2025. This performance demonstrates the successful delivery of DFCC Bank’s strategic growth initiatives, driven by a selective and disciplined lending approach that balances sustainable expansion with asset quality. The renewed confidence amid improving economic conditions reinforces the Bank’s role in driving prudent credit expansion and supporting national economic initiatives.
LIABILITIES
The Bank’s total liabilities increased by LKR 27 Bn, reflecting a 4% growth from December 2025. The deposit base expanded by 7%, rising by LKR 39 Bn to LKR 604 Bn, up from LKR 565 Bn as at 31 December 2025, resulting in a loan-to-deposit ratio of 97.75%. Additionally, the CASA ratio stood at 24.20% as of 31 March 2026.
The Bank effectively contained funding costs by utilising medium- to long-term concessionary credit lines, which supported the expansion of the lending portfolio and provided concessionary funding to customers. Factoring in these term borrowings, the CASA ratio further improved to 29.60%, while the loan-to-deposit ratio improved to 90.79% as of 31 March 2026.
EQUITY AND COMPLIANCE WITH CAPITAL REQUIREMENTS
As at 31 March 2026, total equity was maintained at LKR 107 Bn supported by a profit after tax of LKR 1.7 Bn and fair value gains across the Bank’s securities portfolios.
In alignment with the Bank’s growth strategy and the improving economic environment, the net loan portfolio grew by 5%. Leveraging the strengthened equity base, the Bank effectively absorbed the additional capital requirements associated with portfolio growth. The Tier 1 Capital Ratio was maintained at 12.118%, while the Total Capital Ratio stood at 16.046%, supported by the successful GSS+ bond issuance, compared to 13.550% and 15.933%, respectively, as at December 2025.
The Bank’s dividend policy is designed to optimise shareholder value while maintaining sufficient capital to support future growth, underpinned by its island-wide presence and continued investments in technology. In line with this policy, a final dividend of LKR 7.50 per share, comprising a cash dividend of LKR 2.50 per share and a scrip dividend of LKR 5.00 per share, was paid during the first quarter of 2026, amounting to a total distribution of LKR 3.3 Bn as at 31 March 2026.
The Bank’s Net Stable Funding Ratio (NSFR) stood at 126.54%, and the Liquidity Coverage Ratio (LCR) – all currency – stood at 154.41%, both comfortably exceeding regulatory minimums.
CEO’s Statement
DFCC Bank’s performance in the first quarter of 2026 reflects a measured and disciplined approach within a steadily evolving operating environment. While profitability moderated during the period, this was primarily driven by a deliberate strengthening of impairment provisioning in response to emerging global and domestic risks, including heightened geopolitical uncertainty. The Group also adopted proactive and prudent measures during the quarter, including management overlays, selective lending strategies, and disciplined cost management, to safeguard long-term stability and strengthen resilience against unforeseen external shocks.
For the period ended 31 March 2026, the Group recorded a Profit After Tax of LKR 1.8 Bn, supported by steady growth in lending and deposits, an improved funding mix, and continued attention to asset quality. These fundamentals continue to position DFCC Bank to navigate uncertainty while remaining aligned with opportunities for sustainable expansion.
During the quarter, the Bank continued to advance key strategic priorities. Following the acquisition agreement signed in 2025 with Standard Chartered Bank PLC for its Wealth and Retail Banking operations in Sri Lanka, integration and migration activities are currently underway as the Bank progresses towards completion. This initiative represents a significant step in strengthening DFCC Bank’s retail and affluent banking franchise.
The Bank also reinforced its position in sustainable finance through the successful issuance of a Basel III-compliant, listed, rated GSS+ Bond amounting to LKR 10 Bn, which was oversubscribed. This reflects strong investor confidence and builds on DFCC Bank’s broader track record in sustainable capital markets, including earlier initiatives in thematic bond issuance and international market engagement.
At the same time, DFCC Bank’s continued focus on improving customer experience and accessibility was recognised at the LankaPay Technovation Awards 2026, where the Bank received a Gold Award for Financial Inclusivity and a Merit Award for Customer Convenience. These recognitions reflect the Bank’s ongoing efforts to leverage digital capabilities to simplify banking and expand access for customers.
The Bank’s wider institutional strength continues to be reflected through sustained recognition across people, sustainability, and governance. Building on recognitions such as Great Place to Work and its ranking among the AICPA & CIMA Top 20 Employers, DFCC Bank remains committed to strengthening its organisational culture while delivering responsible growth. Initiatives such as Ride for Life, together with ongoing environmental conservation efforts focused on protecting the Sri
Lankan leopard and preserving ecological balance, further reflect the Bank’s role beyond financial intermediation, contributing to the well-being of communities and the environment.
On behalf of DFCC Bank, I remain grateful to our customers, regulators, and stakeholders for the trust placed in the institution. This trust continues to guide decision-making, ensuring that growth is pursued with discipline, transparency, and a long-term perspective.
As the year progresses, the Bank remains focused on strengthening its core business, executing its strategic priorities, and maintaining financial resilience. With clear direction, strong fundamentals, and disciplined execution, DFCC Bank remains well positioned to deliver sustained and responsible growth.
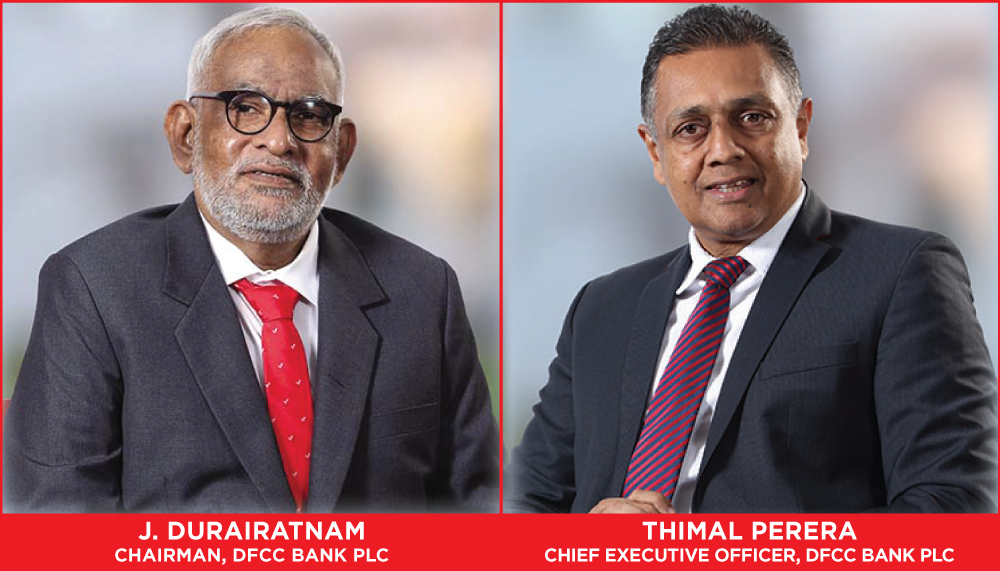
Thimal Perera
Director/Chief Executive Officer 07 May 2026
DFCC Bank PLC
Income Statement
Bank Group
| For the three months ended 31 March Notes | 2026 | 2025 Change | 2026 | 2025 Change | ||
| LKR 000 | LKR 000 % | LKR 000 | LKR 000 % | |||
| Gross Income | 26,415,618 | 23,074,290 14 | 26,625,465 | 23,275,215 14 | ||
| Interest income | 22,067,174 | 19,140,845 | 15 | 22,067,909 | 19,141,576 | 15 |
| Interest expenses | 13,744,054 | 11,731,633 | 17 | 13,726,738 | 11,713,599 | 17 |
| Net interest income | 8,323,120 | 7,409,212 | 12 | 8,341,171 | 7,427,977 | 12 |
| Fee and commission income Fee and commission expenses |
2,725,687
809,567 |
1,913,593
479,238 |
42
69 |
2,725,494
809,567 |
1,913,400
479,238 |
42
69 |
| Net fee and commission income | 1,916,120 | 1,434,355 | 34 | 1,915,927 | 1,434,162 | 34 |
| Net (losses)/ gains from trading 5 | (436,423) | 87,149 | (601) | (436,423) | 87,149 | (601) |
| Fair value through other comprehensive income | 678,321 | 683,870 | (1) | 678,321 | 683,870 | (1) |
| Net other operating income 6 | 1,380,859 | 1,248,833 | 11 | 1,590,164 | 1,449,220 | 10 |
| Total operating income | 11,861,997 | 10,863,419 | 9 | 12,089,160 | 11,082,378 | 9 |
| Impairment charge
Loans and advances |
2,429,045 | 858,401 | 183 | 2,429,045 | 858,401 | 183 |
| Sri Lanka International Sovereign Bonds and Debentures | 56,441 | 95,607 | (41) | 56,441 | 95,607 | (41) |
| Other financial assets and credit related commitments | 677,546 | 400,945 | 69 | 677,546 | 400,945 | 69 |
| Net operating income | 8,698,965 | 9,508,466 | (9) | 8,926,128 | 9,727,425 | (8) |
| Operating expenses
Personnel expenses |
2,359,766 | 2,057,382 | 15 | 2,406,269 | 2,100,451 | 15 |
| Depreciation and amortisation | 421,420 | 326,920 | 29 | 434,253 | 340,033 | 28 |
| Other expenses | 2,496,642 | 1,944,819 | 28 | 2,528,926 | 1,964,375 | 29 |
| Total operating expenses | 5,277,828 | 4,329,121 | 22 | 5,369,448 | 4,404,859 | 22 |
| Operating profit before taxes on financial services | 3,421,137 | 5,179,345 | (34) | 3,556,680 | 5,322,566 | (33) |
| Taxes on financial services | 982,506 | 1,217,844 | (19) | 982,506 | 1,217,844 | (19) |
| Operating profit after taxes on financial services | 2,438,631 | 3,961,501 | (38) | 2,574,174 | 4,104,722 | (37) |
| Share of (loss)/ profit of associate | – | – | – | (1,251) | 206 | (707) |
| Profit before income tax
Income tax expense |
2,438,631
723,723 |
3,961,501
1,143,960 |
(38)
(37) |
2,572,923
760,872 |
4,104,928
1,178,364 |
(37)
(35) |
| Profit for the period from continuing operations | 1,714,908 | 2,817,541 | (39) | 1,812,051 | 2,926,564 | (38) |
| Discontinued Operation
Profit for the period from discontinued operations, net of tax |
– | 4,967,916 | (100) | – | 116,274 | (100) |
| Profit for the period | 1,714,908 | 7,785,457 | (78) | 1,812,051 | 3,042,838 | (40) |
| Profit attributable to:
Equity holders of the Bank Non-controlling interests |
1,714,908
– |
7,785,457
– |
(78)
– |
1,768,791
43,260 |
2,992,348
50,490 |
(41)
(14) |
| Profit for the period | 1,714,908 | 7,785,457 | (78) | 1,812,051 | 3,042,838 | (40) |
| Earnings per share | ||||||
| Basic/diluted earnings per ordinary share (LKR) | 17.95 | (78) | 6.90 | (42) | ||
| Basic/diluted earnings per ordinary share (LKR) | ||||||
| – continuing operations | 6.50 | (40) | 6.63 | (39) | ||
Net gains from derecognition of financial assets
| 3.90 |
| 3.90 |
| 4.02 |
| 4.02 |
DFCC Bank PLC
Statement of Profit or Loss and Other Comprehensive Income
For the three months ended 31 March
Bank
Group
| 2026 | 2025 Change | 2026 | 2025 Change | ||
| LKR 000 | LKR 000 % | LKR 000 | LKR 000 % | ||
| 1,714,908 | 7,785,457 (78) | 1,812,051 | 3,042,838 (40) | ||
|
(921,308) |
618,175 |
(249) |
(921,308) |
618,175 |
(249) |
| (678,321) | (683,870) | 1 | (678,321) | (683,870) | 1 |
| (228,179) | (342,085) | 33 | (228,179) | (342,085) | 33 |
| 315,688 | 321,875 | (2) | 315,688 | 321,875 | (2) |
| 411,230 | 58,298 | 605 | 411,230 | 58,298 | 605 |
| (1,100,890) | (27,607) | (3,888) | (1,100,890) | (27,607) | (3,888) |
|
388,359 |
570,126 |
(32) |
388,359 |
570,126 |
(32) |
| 388,359 | 570,126 | (32) | 388,359 | 570,126 | (32) |
| (712,531) | 542,519 | (231) | (712,531) | 542,519 | (231) |
| 1,002,377 | 8,327,976 | (88) | 1,099,520 | 3,585,357 | (69) |
|
1,002,377
– |
8,327,976
– |
(88) |
1,056,260
43,260 |
3,534,867
50,490 |
(70)
(14) |
| 1,002,377 | 8,327,976 | (88) | 1,099,520 | 3,585,357 | (69) |
Profit for the period
Other comprehensive income / (expenses) for the period, net of tax
Items that are or may be reclassified subsequently to income statement
Movement in fair value reserve ( FVOCI debt instrument): Net change in fair value
Reclassified to income statement Movement in hedging reserve:
Cash flow hedge – effective portion of changes in fair value
Cash flow hedge – reclassified to income statement
Related deferred tax
Total other comprehensive expenses that are or may be reclassified subsequently to income statement
Items that will not be reclassified to income statement
Equity investments at FVOCI – net change in fair value
Total other comprehensive income on items that will not be reclassified to income statement
Other comprehensive ( expenses ) / income for the period , net of tax
Total comprehensive income for the period Total comprehensive income attributable to:
Equity holders of the Bank Non-controlling interests
Total comprehensive income for the period
DFCC Bank PLC
Statement of Financial Position
As at
Assets
Cash and cash equivalents
Balances with Central Bank of Sri Lanka Placements with banks
Derivative financial assets
Financial assets measured at fair value through profit or loss
Notes
Bank Group
Financial assets at amortised cost – Loans and advances to customers 7
Financial assets measured at fair value through other comprehensive
income- Loans and advances to customers 8
Financial assets at amortised cost – Debt and other instruments Financial assets measured at fair value through other comprehensive income
Investments in subsidiaries Investment in associate Investment properties Property, plant and equipment Intangible assets and goodwill Deferred tax assets
Current tax assets Other assets Total assets
Liabilities
Due to banks
Derivative financial liabilities
Financial liabilities at amortised cost – Due to depositors 10
Financial liabilities at amortised cost – Due to other borrowers Debt securities issued
Retirement benefit obligations Current tax liabilities Deferred tax liability
Other liabilities and provisions Subordinated term debt
Total liabilities
Equity
Stated capital Statutory reserve fund Retained earnings Other reserves
Total equity attributable to equity holders of the Bank Non-controlling interests
Total equity
Total equity and liabilities
Contingent liabilities and commitments 9
Net assets value per share (LKR)
Memorandum Information
Bank Group
| 31.03.2026 | 31.12.2025 Change | 31.03.2026 | 31.12.2025 Change | ||
| (Audited) | (Audited) | ||||
| LKR 000 | LKR 000 % | LKR 000 | LKR 000 % | ||
| 18,889,782 | 22,771,091 (17) | 18,949,497 | 22,804,954 (17) | ||
| 5,341,762 | 2,952,879 81 | 5,341,762 | 2,952,879 81 | ||
| 26,505,202 | 37,442,912 (29) | 26,505,202 | 37,442,912 (29) | ||
| 8,263,904 | 8,494,001 (3) | 8,263,904 | 8,494,001 (3) | ||
| 12,032,075 | 9,015,005 33 | 12,032,075 | 9,015,005 33 | ||
| 535,694,978 | 510,924,245 5 | 535,694,978 | 510,924,245 5 | ||
| 4,795,290 | 4,619,866 4 | 4,795,290 | 4,619,866 4 | ||
| 119,395,598 | 114,795,690 4 | 119,403,058 | 114,804,987 4 | ||
| 123,424,633 | 124,552,817 (1) | 123,424,633 | 124,552,817 (1) | ||
| 237,035 | 237,035 – | – | – – | ||
| 33,169 | 33,169 – | 40,626 | 41,876 (3) | ||
| 9,879 | 9,879 – | 613,660 | 598,166 3 | ||
| 4,404,158 | 4,508,724 (2) | 4,749,455 | 4,777,359 (1) | ||
| 2,488,237 | 2,608,324 (5) | 2,663,355 | 2,785,560 (4) | ||
| 7,134,044 | 5,731,675 24 | 7,144,523 | 5,745,154 24 | ||
| – | – – | 1,151 | 1,138 1 | ||
| 15,133,019 | 8,449,154 79 | 15,525,460 | 8,678,825 79 | ||
| 883,782,765 | 857,146,466 | 3 | 885,148,629 | 858,239,744 | 3 |
|
5,835,836 521,313 604,292,760 117,449,024 10,009,828 1,242,835 3,378,296 – 15,439,126 18,544,595 |
12,372,311 201,000 564,758,931 134,354,757 12,286,859 1,182,185 2,669,112 – 12,545,239 9,363,299 |
(53) 159 7 (13) (19) 5 27 – 23 98 |
5,835,836 521,313 603,427,872 117,419,978 10,009,828 1,257,285 3,449,586 53,406 16,180,219 18,544,595 |
12,372,311 201,000 563,905,482 134,363,917 12,286,859 1,220,570 2,757,706 54,628 13,018,783 9,363,299 |
(53) 159 7 (13) (19) 3 25 (2) 24 98 |
| 776,713,613 | 749,733,693 | 4 | 776,699,918 | 749,544,555 | 4 |
|
17,388,007 4,459,968 48,737,351 36,483,826 |
15,445,973 4,459,968 50,291,230 37,215,602 |
13 – (3) (2) |
17,388,007 4,459,968 50,660,935 35,319,054 |
15,445,973 4,459,968 52,160,931 36,050,830 |
13 – (3) (2) |
| 107,069,152 | 107,412,773 | (0) | 107,827,964 | 108,117,702 | (0) |
| – | – | 620,747 | 577,487 | 7 | |
| 107,069,152 | 107,412,773 | (0) | 108,448,711 | 108,695,189 | (0) |
| 883,782,765 | 857,146,466 | 3 | 885,148,629 | 858,239,744 | 3 |
| 285,426,599 | 262,236,519 | 9 | 285,426,599 | 262,236,519 | 9 |
| 237.55 | 245.01 | (3) | 239.24 | 246.62 | (3) |
31.03.2026 31.12.2025 31.03.2026 31.12.2025
Number of Employees 2,567 2,500 2,653 2,578
Number of Branches (Including Service centres) 133 133
Statement of Changes in Equity
Statutory reserve
fund Other reserves
| LKR 000 LKR 000 LKR 000 | LKR 000 | LKR 000 | LKR 000 | LKR 000 | |||
| Bank | |||||||
| Balance as at 01 January 2025 14,710,454 3,657,968 15,385,597 | 664,409 | 13,779,839 | 35,834,730 | 84,032,997 | |||
| Profit for the period | – | – | – | – | – | 7,785,457 | 7,785,457 |
| Other comprehensive income/ (expenses) , net of tax | – | – | 556,666 | (14,147) | – | – | 542,519 |
| Total comprehensive income/ (expenses) for the period | – | – | 556,666 | (14,147) | – | 7,785,457 | 8,327,976 |
| Transfer of net gains on disposal of equity investments at fair value
through other comprehensive income to retained earnings |
– | – | (153,462) | – | – | 153,462 | – |
Stated Reserve Fair value Hedging General Retained Total capital fund reserve reserve reserve earnings equity
| Transactions with equity holders of the Bank, | |||||||
| recognised directly in equity | |||||||
| Final dividend for 2024 – Scrip | 735,519 | – | – | – | – (735,519) – | ||
| Final dividend for 2024 – Cash – – | – | – | – | (1,860,429) | (1,860,429) | ||
| Total contributions from and distribution to
equity holders 735,519 – |
– | – | – | (2,595,948) | (1,860,429) | ||
| Balance as at 31 March 2025 | 15,445,973 | 3,657,968 | 15,788,801 | 650,262 | 13,779,839 | 41,177,701 | 90,500,544 |
| Balance as at 01 January 2026 | 15,445,973 | 4,459,968 | 23,149,281 | 286,482 | 13,779,839 | 50,291,230 | 107,412,773 |
| Profit for the period | – | – | – | – | – | 1,714,908 | 1,714,908 |
| Other comprehensive (expenses)/ income , net of tax | – | – | (773,787) | 61,256 | – | – | (712,531) |
| Total comprehensive (expenses)/ income for the period | – | – | (773,787) | 61,256 | – | 1,714,908 | 1,002,377 |
| Transfer of net gains on disposal of equity investments at fair value | |||||||
| through other comprehensive income to retained earnings – – (19,245) | – | – | 19,245 | – | |||
| Transactions with equity holders of the Bank,
recognised directly in equity |
|||||||
| Final dividend for 2025 – Scrip 1,942,034 – – | – | – | (1,942,034) | – | |||
| Final dividend for 2025 – Cash | (1,345,998) | (1,345,998) | |||||
| Total contributions from and distribution to
equity holders |
1,942,034 | – | – | – | – | (3,288,032) | (1,345,998) |
| Balance as at 31 March 2026 | 17,388,007 | 4,459,968 | 22,356,249 | 347,738 | 13,779,839 | 48,737,351 | 107,069,152 |
Statement of Changes in Equity
Statutory reserve
Attributable to the equity holders of the Bank
| Stated Capital | Reserve fund | Fair value reserve | Exchange
equalization reserve |
Hedging reserve | General reserve | Retained earnings | Total | Non- controlling interests | Total equity | |
| LKR 000 | LKR 000 | LKR 000 | LKR 000 | LKR 000 | LKR 000 | LKR 000 | LKR 000 | LKR 000 | LKR 000 | |
| Group | ||||||||||
| Balance as at 01 January 2025 14,710,454 | 3,657,968 | 13,954,598 | 294,630 | 334,526 | 13,779,839 | 42,668,104 | 89,400,119 | 446,431 | 89,846,550 | |
| Profit for the period – | – | – | – | – | – | 2,992,348 | 2,992,348 | 50,490 | 3,042,838 | |
| Other comprehensive income / (expenses) , net of tax – | – | 556,666 | – | (14,147) | – | – | 542,519 | – | 542,519 | |
| Total comprehensive income / (expenses) for the period – | – | 556,666 | – | (14,147) | – | 2,992,348 | 3,534,867 | 50,490 | 3,585,357 | |
| Transfers – | – | 25,294 | (294,630) | 329,883 | – | (60,547) | – | – | – | |
| Transfer of net gains on disposal of equity investments at fair value – | – | (153,462) | – | – | – | 153,462 | – | – | – | |
| Transactions with equity holders of the Bank, recognized directly in | ||||||||||
| equity | ||||||||||
| Final dividend for 2024 – Scrip | 735,519 | – | – – – – (735,519) – – – | |||||||
| Final dividend for 2024 – Cash | – | – | – – – – (1,860,429) (1,860,429) – (1,860,429) | |||||||
| Total contributions from and distribution to equity holders | 735,519 | – | – – – – (2,595,948) (1,860,429) – (1,860,429) | |||||||
| Balance as at 31 March 2025 | 15,445,973 | 3,657,968 | 14,383,096 – 650,262 13,779,839 43,157,419 91,074,557 496,921 91,571,478 | |||||||
fund Other reserves
through other comprehensive income to retained earnings
| Balance at 01 January 2026 | 15,445,973 | 4,459,968 | 21,984,509 | – | 286,482 | 13,779,839 | 52,160,931 | 108,117,702 | 577,487 | 108,695,189 | |
| Profit for the period | – | – | – | – | – | – | 1,768,791 | 1,768,791 | 43,260 | 1,812,051 | |
| Other comprehensive (expenses)/ income , net of tax | – | – | (773,787) | – | 61,256 | – | – | (712,531) | – | (712,531) | |
| Total comprehensive (expenses)/ income for the period | – | – | (773,787) | – | 61,256 | – | 1,768,791 | 1,056,260 | 43,260 | 1,099,520 | |
| Transfer of net gains on disposal of equity investments at fair value | |||||||||||
| through other comprehensive income to retained earnings | – | – | (19,245) | – | – | – | 19,245 | – | – | – | |
| Transactions with equity holders of the Bank, recognized directly in | |||||||||||
| equity | |||||||||||
| Final dividend for 2025 – Scrip | 1,942,034 | – | – | – | – | – | (1,942,034) | – | – | – | |
| Final dividend for 2025 – Cash | – | – | – | – | – | – | (1,345,998) | (1,345,998) | – | (1,345,998) | |
| Total contributions from and distribution to equity holders | 1,942,034 | – | – | – | – | – | (3,288,032) | (1,345,998) | – | (1,345,998) | |
| Balance as at 31 March 2026 | 17,388,007 | 4,459,968 | 21,191,477 | – | 347,738 | 13,779,839 | 50,660,935 | 107,827,964 | 620,747 | 108,448,711 | |
Statement of Cash Flows
BANK GROUP
| For the period ended 31st March | 2026 | 2025 | 2026 | 2025 |
| LKR 000 | LKR 000 | LKR 000 | LKR 000 | |
| Cash flows from operating activities | ||||
| Interest receipts | 19,656,890 | 17,297,916 | 19,672,008 | 17,315,346 |
| Interest payments | (12,740,279) | (11,441,693) | (12,740,229) | (11,440,288) |
| Net commission receipts | 1,987,799 | 1,842,969 | 1,987,799 | 1,842,969 |
| Net trading income | 77,744 | 181,744 | 77,744 | 181,744 |
| Receipts from other operating activities | 84,292 | 42,929 | 288,478 | 253,555 |
| Payments on other operating activities | (3,996,232) | (2,183,804) | (3,996,346) | (2,134,465) |
| Cash payments to employees | (2,119,591) | (1,987,315) | (2,351,080) | (2,093,782) |
| Taxes on financial services | (908,812) | (1,203,611) | (908,812) | (1,203,611) |
| Operating Cash flows before changes in operating assets and liabilities | 2,041,811 | 2,583,855 | 2,029,562 | 2,756,188 |
| (Increase)/ decrease in operating assets: | ||||
| Balances with Central Bank / deposits held for regulatory or monetary control purposes | (2,388,883) | (316,830) | (2,388,883) | (316,830) |
| Financial assets at amortised cost – Loans and advances to customers | (26,153,984) | (26,872,574) | (26,153,984) | (26,872,574) |
| Others | (5,249,690) | 634,437 | (5,155,262) | 589,126 |
| Increase / (Decrease) in operating liabilities: | ||||
| Financial liabilities at amortised cost – Due to depositors | 37,380,369 | 33,398,098 | 37,380,347 | 33,328,198 |
| Others | 838,976 | 619,561 | 881,297 | 601,237 |
| Net cash flows from operating activities before income tax | 6,468,599 | 10,046,547 | 6,593,077 | 10,085,345 |
| Income tax paid | (1,000,000) | (2,106,257) | (1,017,162) | (2,130,910) |
| Net cash flows from operating activities | 5,468,599 | 7,940,290 | 5,575,915 | 7,954,435 |
| Cash flows from investing activities | ||||
| Dividend received from other investments | 1,025,387 | 1,211,908 | 1,025,387 | 1,211,908 |
| Government Securities- net | (6,102,440) | (4,805,592) | (6,102,440) | (4,805,592) |
| Proceeds from sale and redemption of securities | 3,543,338 | 2,267,402 | 3,543,338 | 2,267,402 |
| Purchase of financial investments | (1,398,393) | (4,261,009) | (1,401,481) | (4,261,009) |
| Purchase of property , equipment ,intangibles and investment properties | (188,998) | (403,785) | (351,374) | (418,019) |
| Proceeds from disposal of joint venture | – | 6,500,000 | – | 6,500,000 |
| Proceeds from sale of equipment, investment properties and others | 1,241 | – | 1,241 | – |
| Net cash flows (used in) / from investing activities | (3,119,865) | 508,924 | (3,285,329) | 494,690 |
| Cash flows from financing activities | ||||
| Redemption of debentures | (1,784,070) | – | (1,784,070) | – |
| Issue of debentures | 10,000,000 | – | 10,000,000 | – |
| Borrowing , medium and long – term | 2,185,681 | 60,973 | 2,185,681 | 60,973 |
| Other short term borrowings – net | (22,090,677) | 17,839,308 | (22,006,677) | 17,839,308 |
| Repayment of borrowing ,medium and long – term | (4,132,689) | (2,247,447) | (4,132,689) | (2,247,447) |
| Dividends paid | (1,345,998) | (1,730,632) | (1,345,998) | (1,730,632) |
| Net Cash flows (used in) / from financing activities | (17,167,753) | 13,922,202 | (17,083,753) | 13,922,202 |
| Net (decrease) / increase in cash and cash equivalents | (14,819,019) | 22,371,416 | (14,793,167) | 22,371,327 |
| Cash and cash equivalents at the beginning of the period | 60,214,003 | 24,734,298 | 60,247,866 | 24,752,967 |
| Cash and cash equivalents at the end of the period | 45,394,984 | 47,105,714 | 45,454,699 | 47,124,294 |
| Reconciliation of cash and cash equivalents with items | ||||
| reported in the statement of financial position | ||||
| Cash and cash equivalents | 18,889,782 | 16,188,891 | 18,949,497 | 16,207,471 |
| Placements with banks | 26,505,202 | 30,916,823 | 26,505,202 | 30,916,823 |
| 45,394,984 | 47,105,714 | 45,454,699 | 47,124,294 |
The Statement of Cash Flows of the Bank includes the results of associate and subsidiary companies only to the extent of the cash flows between Bank and respective companies as required by Sri Lanka Accouting Standards.
Explanatory Notes
Note 1. Statement of Compliance
The consolidated financial statements of the Group and the separate financial statements of the Bank have been presented in accordance with the Sri Lanka Accounting Standards 34 (LKAS 34) “Interim Financial Statements” issued by The Institute of Chartered Accountants of Sri Lanka (CA Sri Lanka) and in compliance with the requirements of the Companies Act, No. 07 of 2007 and the Banking Act No. 30 of 1988 and amendments thereto.
Note 2. Accounting Policies and Accounting Estimates
There were no changes to the accounting policies and method of computation since the publication of the last annual financial statements.
Note 3. Group Financial Statements
The Group Financial Statements comprise the Bank and its subsidiaries DFCC Consulting (Pvt) Limited, Lanka Industrial Estates Limited and Synapsys Limited and group interest in associate company National Asset Management Limited. Investments in Subsidiaries and associate companies are accounted under cost method in Bank’s financial statements. Investment in associate is accounted under equity method in group’s financial statements.
Note 4. Expected Credit Loss calculation
In response to the current and potential future impacts of global and domestic economic conditions on the Bank’s lending portfolio, management strengthened impairment provisioning during the period. This was underpinned by enhancements to internal expected credit loss models designed to better capture risk factors not fully observable in the prevailing volatile geopolitical and economic environment, including the application of management overlays to recognize additional provisions for exposures to higher-risk sectors and customer segments.
Note 5. Net (losses) / gains from trading
Bank
Group
| For the period ended 31 March | 2026 | 2025 | 2026 | 2025 |
| LKR 000 | LKR 000 | LKR 000 | LKR 000 | |
| Derivative Financial Instruments | ||||
| Forward exchange fair value changes from banks and other customers | (1,034,802) | 958,602 | (1,034,802) | 958,602 |
| Gains on financial assets fair value through profit or loss – equity securities | 31,456 | 31,324 | 31,456 | 31,324 |
| Foreign exchange from Banks and Other Customers | 1,020,357 | (930,896) | 1,020,357 | (930,896) |
| Financial assets recognized through profit or loss – measured at fair value | ||||
| Government securities | ||||
| – Net marked to market losses | (21,815) | (8,331) | (21,815) | (8,331) |
| – Net capital (losses)/ gains | (14,203) | 38,660 | (14,203) | 38,660 |
| Equities | ||||
| – Net marked to market losses | (568,516) | (197,266) | (568,516) | (197,266) |
| – Net capital gains | 91,947 | 143,083 | 91,947 | 143,083 |
| – Dividend income | 59,153 | 51,973 | 59,153 | 51,973 |
| (436,423) | 87,149 | (436,423) | 87,149 | |
| Note 6. Net Other Operating Income | Bank | Group | ||
| For the period ended 31 March
Financial assets measured at fair value through other comprehensive income |
2026
LKR 000 |
2025
LKR 000 |
2026
LKR 000 |
2025
LKR 000 |
| Dividend income | 1,341,882 | 1,211,908 | 1,341,882 | 1,211,908 |
| Premises rental income | – | – | 139,251 | 123,666 |
| Net losses on sale of property, plant and equipment | (2,382) | (14,663) | (2,382) | (14,663) |
| Foreign exchange (losses)/ gains | (7,448) | 5,264 | (5,121) | 7,945 |
| Recovery of loans written-off | 31,100 | 34,720 | 31,100 | 34,720 |
| Others | 17,707
1,380,859 |
11,604
1,248,833 |
85,434
1,590,164 |
85,644
1,449,220 |
| Note 7. Financial assets at amortised cost – Loans and advances to customers | ||||
| Bank | Group | |||
| As at | 31.03.2026 | 31.12.2025 | 31.03.2026 | 31.12.2025 |
| (Audited) | (Audited) | |||
| LKR 000 | LKR 000 | LKR 000 | LKR 000 | |
| Gross loans and advances to customers (Note 7.1) | 585,923,647 | 558,990,709 | 585,923,647 | 558,990,709 |
| Less: Allowance for impairment (Note 7.2) | (50,228,669) | (48,066,464) | (50,228,669) | (48,066,464) |
| Net loans and advances to customers | 535,694,978 | 510,924,245 | 535,694,978 | 510,924,245 |
| Note 7.1 Gross loans and advances to customers – By product | ||||
| Bank | Group | |||
| As at | 31.03.2026 | 31.12.2025 | 31.03.2026 | 31.12.2025 |
| (Audited) | (Audited) | |||
| LKR 000 | LKR 000 | LKR 000 | LKR 000 | |
| By product-Domestic Currency | ||||
| Overdrafts | 66,150,884 | 63,842,754 | 66,150,884 | 63,842,754 |
| Trade finance | 61,724,507 | 68,498,285 | 61,724,507 | 68,498,285 |
| Credit cards | 10,544,429 | 9,929,497 | 10,544,429 | 9,929,497 |
| Pawning and Gold Loan | 31,656,446 | 27,152,004 | 31,656,446 | 27,152,004 |
| Staff loans | 4,697,517 | 4,223,112 | 4,697,517 | 4,223,112 |
| Term loans | 261,274,086 | 252,817,466 | 261,274,086 | 252,817,466 |
| Lease rentals receivable | 36,949,989 | 35,710,221 | 36,949,989 | 35,710,221 |
| Housing loans | 22,281,220 | 20,574,966 | 22,281,220 | 20,574,966 |
| Securities purchased under resale agreements | 500,666 | 155,038 | 500,666 | 155,038 |
| 495,779,744 | 482,903,343 | 495,779,744 | 482,903,343 | |
| By product-Foreign Currency | ||||
| Overdrafts | 3,463,305 | 2,723,660 | 3,463,305 | 2,723,660 |
| Trade finance | 33,637,905 | 26,509,890 | 33,637,905 | 26,509,890 |
| Term loans | 53,042,693 | 46,853,816 | 53,042,693 | 46,853,816 |
| 90,143,903 | 76,087,366 | 90,143,903 | 76,087,366 | |
| Gross loans and advances to customers | 585,923,647 | 558,990,709 | 585,923,647 | 558,990,709 |
| Note 7.2 Movement in Impairment during the period | ||||
| Bank | Group | |||
| 31.03.2026 | 31.12.2025 | 31.03.2026 | 31.12.2025 | |
| (Audited) | (Audited) | |||
| LKR 000 | LKR 000 | LKR 000 | LKR 000 | |
| Stage 1
Balance at beginning |
3,835,956 | 3,412,778 | 3,835,956 | 3,412,778 |
| Charge to income statement | 679,297 | 423,178 | 679,297 | 423,178 |
| Balance at end | 4,515,253 | 3,835,956 | 4,515,253 | 3,835,956 |
|
Stage 2
Balance at beginning |
3,572,259 |
5,930,684 |
3,572,259 |
5,930,684 |
| Charge/ (reversal) to income statement | 1,590,724 | (2,358,425) | 1,590,724 | (2,358,425) |
| Balance at end | 5,162,983 | 3,572,259 | 5,162,983 | 3,572,259 |
|
Stage 3
Balance at beginning |
40,658,249 |
36,516,429 |
40,658,249 |
36,516,429 |
| Charge to income statement | 159,025 | 6,726,680 | 159,025 | 6,726,680 |
| Other movements | (266,841) | (2,584,860) | (266,841) | (2,584,860) |
| Balance at end | 40,550,433 | 40,658,249 | 40,550,433 | 40,658,249 |
| Total Impairment | 50,228,669 | 48,066,464 | 50,228,669 | 48,066,464 |
Note 8. Financial assets measured at fair value through other comprehensive income- Loans and advances to customers
Bank Group
| As at | 31.03.2026
LKR 000 |
31.12.2025
(Audited) LKR 000 |
31.03.2026
LKR 000 |
31.12.2025
(Audited) LKR 000 |
|
| Gross loans and advances to customers (Note 8.1) | 4,780,985 | 4,605,823 | 4,780,985 | 4,605,823 | |
| Fair value adjustment including impairment | 14,305 | 14,043 | 14,305 | 14,043 | |
| 4,795,290 | 4,619,866 | 4,795,290 | 4,619,866 | ||
| Note 8.1 Gross loans and advances to customers – By product
As at |
31.03.2026 | Bank | 31.12.2025 | Group 31.03.2026 | 31.12.2025 |
| By product-Foreign Currency | LKR 000 | (Audited)
LKR 000 |
LKR 000 | (Audited)
LKR 000 |
|
| Term loans | 4,780,985 | 4,605,823 | 4,780,985 | 4,605,823 | |
| Gross loans and advances to customers | 4,780,985 | 4,605,823 | 4,780,985 | 4,605,823 | |
| As at | Bank | Group | ||
| 31.03.2026
LKR 000 |
31.12.2025
(Audited) LKR 000 |
31.03.2026
LKR 000 |
31.12.2025
(Audited) LKR 000 |
|
| Gross commitment and contingencies | 285,426,599 | 262,236,519 | 285,426,599 | 262,236,519 |
| Accumulated impairment under stage 1 | 1,038,991 | 729,016 | 1,038,991 | 729,016 |
| Accumulated impairment under stage 2 | 83,111 | 85,320 | 83,111 | 85,320 |
| Accumulated impairment under stage 3 | 855,866 | 486,086 | 855,866 | 486,086 |
| Net commitments and contingencies | 283,448,631 | 260,936,097 | 283,448,631 | 260,936,097 |
| Product-wise commitments and contingencies | ||||
| Domestic currency | ||||
| Credit related commitments and contingencies | ||||
| Undrawn -Credit facilities | 119,988,154 | 103,815,220 | 119,988,154 | 103,815,220 |
| Acceptances | 46,453 | 67,255 | 46,453 | 67,255 |
| Documentary Letter of credit | 499,638 | 883,355 | 499,638 | 883,355 |
| Guarantees and other Commitments | 24,719,842 | 23,587,426 | 24,719,842 | 23,587,426 |
| 145,254,087 | 128,353,256 | 145,254,087 | 128,353,256 | |
| Other commitments and contingencies |
283,503 1,994,069 |
9,568 30,808 |
283,503 1,994,069 |
9,568 30,808 |
| Capital commitments Bid Bonds | ||||
| 2,277,572 | 40,376 | 2,277,572 | 40,376 | |
| Sub total | 147,531,659 | 128,393,632 | 147,531,659 | 128,393,632 |
| Foreign currency | ||||
| Credit related commitments and contingencies | ||||
| Undrawn – Credit facilities | 20,133,494 | 17,331,607 | 20,133,494 | 17,331,607 |
| Acceptances | 13,644,743 | 13,296,462 | 13,644,743 | 13,296,462 |
| Documentary Letter of credit | 42,931,737 | 24,671,112 | 42,931,737 | 24,671,112 |
| Guarantees and other Commitments | 4,935,420 | 6,248,828 | 4,935,420 | 6,248,828 |
| 81,645,394 | 61,548,009 | 81,645,394 | 61,548,009 | |
| Other commitments and contingencies | ||||
| Forward exchange contracts | 56,104,286 | 69,229,821 | 56,104,286 | 69,229,821 |
| Capital commitments | 135,580 | 831,313 | 135,580 | 831,313 |
| Bid Bonds | 9,680 | 2,233,744 | 9,680 | 2,233,744 |
| 56,249,546 | 72,294,878 | 56,249,546 | 72,294,878 | |
| Sub total | 137,894,940 | 133,842,887 | 137,894,940 | 133,842,887 |
| Total gross commitments and contingencies | 285,426,599 | 262,236,519 | 285,426,599 | 262,236,519 |
Note 9 . Analysis of Commitments and Contingencies and Impairment
9.1
9.2
| Bank | Stage 01
LKR 000 |
Stage 02
LKR 000 |
Stage 03
LKR 000 |
Total
LKR 000 |
| Balance as at 1st January 2026
Net charge to profit or loss |
729,016
309,975 |
85,320
(2,209) |
486,086
369,780 |
1,300,422
677,546 |
| Balance as at 31 March 2026 | 1,038,991 | 83,111 | 855,866 | 1,977,968 |
9.3
| Group | Stage 01
LKR 000 |
Stage 02
LKR 000 |
Stage 03
LKR 000 |
Total
LKR 000 |
| Balance as at 1st January 2026
Net charge to profit or loss |
729,016
309,975 |
85,320
(2,209) |
486,086
369,780 |
1,300,422
677,546 |
| Balance as at 31 March 2026 | 1,038,991 | 83,111 | 855,866 | 1,977,968 |
| Note 10. Financial liabilities at amortized cost – Due to depositors | Bank | Group | ||
| As at | 31.03.2026
LKR 000 |
31.12.2025
(Audited) LKR 000 |
31.03.2026
LKR 000 |
31.12.2025
(Audited) LKR 000 |
| By product-Domestic Currency
Demand deposits (current accounts) |
19,979,061 | 18,627,881 | 19,974,462 | 18,628,202 |
| Savings deposits | 83,662,609 | 80,519,431 | 83,628,484 | 80,460,726 |
| Fixed deposits | 357,143,700 | 324,846,244 | 356,335,771 | 324,089,942 |
| Other deposits | 2,086,705 | 1,501,962 | 2,086,705 | 1,501,962 |
| 462,872,075 | 425,495,518 | 462,025,422 | 424,680,832 | |
| By product- Foreign Currency | ||||
| Demand deposits (current accounts) | 1,242,870 | 2,263,055 | 1,242,870 | 2,263,055 |
| Savings deposits | 39,273,314 | 35,295,441 | 39,255,079 | 35,256,678 |
| Fixed deposits | 100,897,803 | 101,625,995 | 100,897,803 | 101,625,995 |
| Other deposits | 6,698 | 78,922 | 6,698 | 78,922 |
| 141,420,685 | 139,263,413 | 141,402,450 | 139,224,650 | |
| Total | 604,292,760 | 564,758,931 | 603,427,872 | 563,905,482 |
Note 11. Reclassification of Financial Instruments
Reclassification of Financial Instruments considering the unprecedented changes in the macro-economic conditions, the Institute of Chartered Accountants of Sri Lanka (CA Sri Lanka) has decided to issue the “Statement of Alternative Treatment (SoAT) on Reclassification of Debt Portfolio”. This SoAT will provide a temporary practical expedient to permit the entities to reclassify the debt portfolio measured at Fair Value through Other Comprehensive Income (FVTOCI) to amortised cost.
The Bank used this option to reclassify long term debt instruments subsequent to the initial recognition.The fair value of the debt portfolio reclassified during year 2022 and remaining as at 31 March 2026 amounted to LKR 3.95 Bn. and cumulative fair value gain thereon amounted to LKR 0.09 Bn. (net of tax LKR 0.07 Bn.).
Note 12. Events after the reporting period
There were no material events that took place after the reporting date which require adjustment to or disclosure in the Financial Statements other than below;
- Proposed Acquisition of the wealth and retail banking business of Standard Chartered Bank of sri lanka branch
DFCC Bank PLC has entered into a binding Business Sale Agreement ( BSA) with Standard Chartered Bank, United Kingdom, to acquire the wealth and retail banking operations of Standard Chartered Bank Sri Lanka for purchase consideration of LKR 3.7 Bn and has received approval from the Central Bank of Sri Lanka, in terms of Section 12 (1) (c ) of the Banking Act No.30 of 1988 (as amended), to proceed with the proposed acquisition.
Following receipt of this regulatory approval, DFCC Bank is proceeding with the next phase of the transaction, including the planned migration and integration activities.
Note 13. Disclosures under Listing Rules
- Comparative figures have been re-classified where necessary, to conform to the current period presentation.
During the period, there were no material changes in the composition of assets, liabilities and contingent liabilities. All known expenditure items have been provided for.
There is no management fees or similar expenditure provided for in the Financial Statements.
- Stated capital
Number of shares
As at 31.03.2026 31.12.2025
Number of shares of the Bank 450,715,084 438,404,250
| 13.3 Market price of a share | ||
| Information on shares of the Bank for the quarter ended | 31.03.2026 | 31.12.2025 |
| – Highest price LKR | 163.50 | 175.00 |
| – Lowest price LKR | 125.00 | 137.00 |
| – Market price LKR | 137.75 | 148.00 |
- Twenty Major Shareholders as at 31.03.2026
| Name of Shareholder/Company | Shareholding | % | |
| 1 | Hatton National Bank PLC A/C No 1 | 56,217,170 | 12.47 |
| 2 | Bank of Ceylon-No2 A/C (BOC PTF) | 47,150,696 | 10.46 |
| 3 | Seylan Bank PLC / Phantom Investments (Pvt) Ltd | 45,029,948 | 9.99 |
| 4 | Mr. M.A.Yaseen | 40,047,763 | 8.88 |
| 5 | Sri Lanka Insurance Corporation Ltd-Life Fund | 34,181,983 | 7.58 |
| 6 | Commercial Bank of Ceylon PLC/Ambeon Holdings PLC | 27,758,187 | 6.15 |
| 7 | Melstacorp PLC | 27,744,561 | 6.15 |
| 8 | Seafeld International Limited | 21,960,020 | 4.87 |
| 9 | Renuka City Hotels PLC | 9,125,939 | 2.02 |
| 10 | Ambeon Holdings PLC | 5,438,564 | 1.20 |
| 11 | Renuka Hotels PLC | 5,048,939 | 1.12 |
| 12 | Metrocorp (Pvt) Ltd | 4,999,156 | 1.10 |
| 13 | Employees Trust Fund Board | 4,549,907 | 1.00 |
| 14 | Hatton National Bank PLC/ Colombo City Holdings PLC | 4,215,132 | 0.93 |
| 15 | Cargo Boat Development Company PLC | 3,413,953 | 0.75 |
| 16 | Sampath Bank PLC/Ambeon Holdings PLC | 3,084,243 | 0.68 |
| 17 | Seylan Bank PLC /Ambeon Holdings PLC (Margin Trading) | 3,069,228 | 0.68 |
| 18 | Akbar Brothers Pvt Ltd | 2,723,725 | 0.60 |
| 19 | Sri Lanka Insurance Corporation Ltd- General Fund | 2,669,572 | 0.59 |
| 20 | Stassen Exports (Pvt) Limited | 2,351,075 | 0.52 |
- Public Holdings as at 31.03.2026
Public holdings percentage 77.04%
Number of Public shareholders 19,140
Float adjusted market capitalisation LKR 47,831 million
Applicable option as per CSE Listing Rule 7.13.1 (i) (a) Option 1
- Directors’ Interests in Shares
No of Shares
As at 31.03.2026
J Durairatnam Nil
Ms L K A H Fernando Nil
N K G K Nemmawatta Nil
N H T I Perera 27,573
Ms A L Thambiayah Nil
N Vasantha Kumar Nil
H A J de Silva Wijeyeratne 13,783
P A Jayatunga Nil
I A Wickramasinghe Nil
Ms A K Moonesinghe Nil
Certification
I certify that these financial statements comply with the requirements of the Companies Act No. 07 of 2007.
Chinthika Amarasekera Chief Financial Officer
We, the undersigned, being the Chairman, the Chief Executive Officer of DFCC Bank PLC certify that:
- the above statements have been prepared in compliance with the format and definitions prescribed by the Central Bank of Sri Lanka.
- the information contained in these statements have been extracted from the unaudited financial statements of the Bank and the Group unless indicated as audited.
- Durairatnam Thimal Perera
Chairman Director / Chief Executive Officer
7-May-26
Listed Debentures
Interest rate of Comparative Government
| Interest rate | Effective | Coupon | Securities | ||||||||
| Frequency | Rate | Rate | (Gross) | p.a. | Balance as at | ||||||
| % | % | % | 31.03.2026 | Market price LKR | Yield | Last | |||||
| LKR 000 | Highest | Lowest | Last Traded | Last Traded % | Traded Date | ||||||
| Debenture Category | |||||||||||
| Fixed Rate
2019/2029 |
Annually | 13.90 | 13.90 | 9.50 | 4,410,684 | N/T | N/T | N/T | N/T | N/T | |
| 2020/2027 | Annually | 9.25 | 9.25 | 8.83 | 212,915 | N/T | N/T | N/T | N/T | N/T | |
| 2024/2027 | Annually | 12.00 | 12.00 | 8.74 | 2,651,663 | 100.99 | 100.99 | 100.99 | 11.15 | 6-Mar-26 | |
| 2024/2029 | Annually | 15.25 | 15.25 | 9.46 | 8,168,629 | N/T | N/T | N/T | N/T | N/T | |
| 2024/2031 | Annually | 14.75 | 14.75 | 9.97 | 56,265 | N/T | N/T | N/T | N/T | N/T | |
| 2025/2028 | Annually | 9.75 | 9.75 | 9.49 | 135,923 | N/T | N/T | N/T | N/T | N/T | |
| 2025/2028 | Zero Coupon Bond | *9.75 | – | 9.49 | 21,555 | N/T | N/T | N/T | N/T | N/T | |
| 2025/2029 | Annually | 10.25 | 10.25 | 9.77 | 870,191 | N/T | N/T | N/T | N/T | N/T | |
| 2025/2029 | Zero Coupon Bond | *10.25 | – | 9.77 | 188,642 | N/T | N/T | N/T | N/T | N/T | |
| 2025/2030 | Annually | 10.50 | 10.50 | 9.83 | 1,645,494 | N/T | N/T | N/T | N/T | N/T | |
| 2025/2030 | Zero Coupon Bond | *10.50 | – | 9.83 | 85,675 | N/T | N/T | N/T | N/T | N/T | |
| 2026/2031 | Annually | 11.50 | 11.50 | 9.97 | 9,674,992 | N/T | N/T | N/T | N/T | N/T | |
| 2026/2033 | Annually | 11.75 | 11.75 | 10.55 | 192,669 | N/T | N/T | N/T | N/T | N/T | |
| 2026/2036 | Annually | 12.00 | 12.00 | 10.96 | 239,125 | N/T | N/T | N/T | N/T | N/T | |
| N/T -Not traded | |||||||||||
| *Annual Compounding on the Issue Price Payable on the Date of Redemption | |||||||||||
Disclosures regarding the utilization of funds as per the objectives stated in the Green Bond Issue Prospectus
|
Objective as per Prospectus |
Amount allocated as per Prospectus | Proposed Date of
allocation as per Prospectus |
Amount allocated from Proceeds (A) |
% of Total Proceeds |
Amount utilized as at 31.03.2026 (B) | % of utilization
against allocation (B/A) |
Clarification if not fully utilized including where
the funds are invested (eg:Whether lent to related party/s etc.) |
| Financing the establishment, acquisition, expansion, and/or ongoing management of on – shore ground and rooftop mounted solar photovoltaic (PV) power generation facilities |
LKR 2,500 Mn (Maximum issuance) |
Within 18 months upon allotment of the Bonds |
LKR 2,500 Mn |
100.0% |
LKR 2,500 Mn |
100.0% |
N/A |
| Refinancing existing on-shore ground and rooftop mounted solar photovoltaic (PV) power generation facilities provided such projects were approved for financing by the Bank and were commissioned within a two (2) year ‘lookback’ period from the date the project was earmarked for funding by the proceeds of the particular
Green Bond. |
Immediately, upon allotment of bonds |
Nil |
0.0% |
Nil |
0.0% |
N/A |
* Date of allotment of Green Bonds – 24.09.2024
Disclosures regarding the utilization of funds as per the objectives stated in the Blue Bond Issue Prospectus
|
Objective as per Prospectus |
Amount allocated as per Prospectus |
Proposed Date of allocation as per Prospectus |
Amount allocated from Proceeds (A) |
% of Total Proceeds |
Amount utilized as at 31.03.2026 (B) |
% of utilization against allocation (B/A) |
Clarification if not fully utilized including where the funds are invested (eg:Whether lent to related party/s etc.) |
| Promoting a sustainable blue economy | LKR 3,000 Mn | Within 18 months upon allotment of the Bonds | LKR 3,000 Mn | 100.0% | LKR 490 Mn | 16.3% | Invested in Government Securities |
* Date of allotment of Blue Bonds – 21.11.2025
Disclosures regarding the utilization of funds as per the objectives stated in the GSS+ bond Issue Prospectus
|
Objective as per Prospectus |
Amount allocated as per Prospectus | Proposed Date of allocation as per Prospectus | Amount allocated from Proceeds (A) |
% of Total Proceeds |
Amount utilized as at 31.03.2026 (B) | % of utilization against allocation (B/A) | Clarification if not fully utilized including where the funds are invested (eg:Whether lent to related party/s etc.) |
| Improve the Tier 2 Capital Adequacy Ratio (CAR) |
LKR 10,000 Mn |
Immediately | LKR 10,000 Mn | 100.0% | LKR 10,000 Mn | 100.0% | N/A |
| Support the Bank’s Balance Sheet Growth Through Financing and/or Refinancing GSS+ Projects | Within 18 months upon allotment of the Bonds |
LKR 10,000 Mn |
100.0% |
LKR 6,027 Mn |
60.3% |
Invested in Government Securities |
* Date of allotment of GSS+ Bonds – 13.02.2026
Selected Performance Indicators
| Item | Bank | Group | ||
| 31.03.2026 | 31.12.2025 | 31.03.2026 | 31.12.2025 | |
| Regulatory Capital Adequacy ( LKR ‘000) | ||||
| Common Equity Tier I | 63,900,819 | 68,302,317 | 64,445,531 | 68,840,059 |
| Tier 1 Capital | 63,900,819 | 68,302,317 | 64,445,531 | 68,840,059 |
| Total Regulatory Capital | 84,616,895 | 80,318,596 | 85,177,067 | 80,869,103 |
| Regulatory Capital Ratios % |
12.118 12.118 16.046 |
13.550 13.550 15.933 |
12.175 12.175 16.092 |
13.610 13.610 15.989 |
| Common Equity Tier 1 Capital Ratio (Minimum requirement – 7%) Tier 1 Capital Ratio (Minimum requirement – 8.5% )
Total Capital Ratio (Minimum requirement – 12.5%) |
||||
| Basel III Leverage Ratio ( Minimum requirement is 3%) | 6.60 | 7.40 | 6.65 | 7.46 |
| Regulatory Liquidity Requirement | ||||
| Liquidity Coverage Ratio (%) – Rupee (Minimum Requirement – 100%) | 289.79 | 190.90 | ||
| Liquidity Coverage Ratio (%) – All Currency (Minimum Requirement – 100%) | 154.41 | 184.06 | ||
| Net Stable Funding Ratio (%) (Minimum requirement – 100%) | 126.54 | 122.64 | ||
| Asset Quality | ||||
| Impaired Loans (Stage 3) to Total Loans Ratio (%)* | 4.18 | 4.55 | ||
| Impairment (Stage 3) to Stage 3 Loans Ratio (%)* | 55.51 | 55.12 | ||
| Income & Profitability
Net Interest margin % Return on assets ( profit before tax from continuing operation) % Return on equity (profit after tax from continuing operation) % Cost to Income Ratio (%) |
3.88 | 3.96 | ||
| 0.56 | 2.00 | |||
| 4.40 | 11.55 | |||
| 49.65 | 36.42 | |||
| Other Ratios | ||||
| Debt to equity ratio (times) | 1.80 | 2.00 | ||
| Interest cover (times) | 1.73 | 2.72 | ||
| Memorandum Information | ||||
| Credit Rating – Fitch | A(lka) | A(lka) | ||
| Number of Employees | 2,567 | 2,500 | ||
| Number of Branches (Including Service centres) | 133 | 133 | ||
* Including Undrawn Portion of Credit
Analysis of Financial Instruments By Measurement Basis
Bank Group
| Fair value | Fair value | Amortised | Total | Fair value | Fair value | Amortised | Total | |
| through | through other | cost | through | through other | cost | |||
| profit or loss – | comprehensive | profit or | comprehensive | |||||
| mandatory | income | loss – | income | |||||
| As at 31 March 2026 | mandatory | |||||||
| LKR 000 | LKR 000 | LKR 000 | LKR 000 | LKR 000 | LKR 000 | LKR 000 | LKR 000 | |
| Financial Assets | ||||||||
| Cash and cash equivalents | – | – | 18,889,782 | 18,889,782 | – | – | 18,949,497 | 18,949,497 |
| Balances with Central Bank of Sri Lanka | – | – | 5,341,762 | 5,341,762 | – | – | 5,341,762 | 5,341,762 |
| Placements with banks | – | – | 26,505,202 | 26,505,202 | – | – | 26,505,202 | 26,505,202 |
| Derivative financial assets | 8,263,904 | – | – | 8,263,904 | 8,263,904 | – | – | 8,263,904 |
| Financial assets measured at fair value through profit or loss | 12,032,075 | – | – | 12,032,075 | 12,032,075 | – | – | 12,032,075 |
| Financial assets at amortised cost -Loans and advances | ||||||||
| to customers | – | – | 535,694,978 | 535,694,978 | – | – | 535,694,978 | 535,694,978 |
| Financial assets measured at fair value through other | ||||||||
| comprehensive income- Loans and advances to customers | – | 4,795,290 | – | 4,795,290 | – | 4,795,290 | – | 4,795,290 |
| Financial assets at amortised cost – Debt and other instruments Financial assets measured at fair value through other | – | – | 119,395,598 | 119,395,598 | – | – | 119,403,058 | 119,403,058 |
| comprehensive income | – | 123,424,633 | – | 123,424,633 | – | 123,424,633 | – | 123,424,633 |
| Other assets | – | – | 11,983,220 | 11,983,220 | – | – | 12,211,488 | 12,211,488 |
| Total financial assets | 20,295,979 | 128,219,923 | 717,810,542 | 866,326,444 | 20,295,979 | 128,219,923 | 718,105,985 | 866,621,887 |
| Financial Liabilities | ||||||||
| Due to banks | – | – | 5,835,836 | 5,835,836 | – | – | 5,835,836 | 5,835,836 |
| Derivative financial liabilities | 521,313 | – | – | 521,313 | 521,313 | – | – | 521,313 |
| Financial liabilities at amortised cost -Due to depositors | – | – | 604,292,760 | 604,292,760 | – | – | 603,427,872 | 603,427,872 |
| Financial liabilities at amortised cost – Due to other borrowers | – | – | 117,449,024 | 117,449,024 | – | – | 117,419,978 | 117,419,978 |
| Debt securities issued | – | – | 10,009,828 | 10,009,828 | – | – | 10,009,828 | 10,009,828 |
| Other liabilities and provisions | – | – | 11,331,398 | 11,331,398 | – | – | 11,890,671 | 11,890,671 |
| Subordinated term debt | – | – | 18,544,595 | 18,544,595 | – | – | 18,544,595 | 18,544,595 |
| Total financial liabilities | 521,313 | – | 767,463,441 | 767,984,754 | 521,313 | – | 767,128,780 | 767,650,093 |
| Bank | Group | |||||||
| Fair value | Fair value | Amortised | Total | Fair value | Fair value | Amortised | Total | |
| through | through other | cost | through | through other | cost | |||
| profit or loss – | comprehensive | profit or | comprehensive | |||||
| mandatory | income | loss – | income | |||||
| As at 31 December 2025 | mandatory | |||||||
| LKR 000 | LKR 000 | LKR 000 | LKR 000 | LKR 000 | LKR 000 | LKR 000 | LKR 000 | |
| Financial Assets | ||||||||
| Cash and cash equivalents | – | – | 22,771,091 | 22,771,091 | – | – | 22,804,954 | 22,804,954 |
| Balances with Central Bank of Sri Lanka | – | – | 2,952,879 | 2,952,879 | – | – | 2,952,879 | 2,952,879 |
| Placements with banks | – | – | 37,442,912 | 37,442,912 | – | – | 37,442,912 | 37,442,912 |
| Derivative financial assets | 8,494,001 | – | – | 8,494,001 | 8,494,001 | – | – | 8,494,001 |
| Financial assets measured at fair value through profit or loss | 9,015,005 | – | – | 9,015,005 | 9,015,005 | – | – | 9,015,005 |
| Financial assets at amortised cost -Loans and advances | ||||||||
| to customers | – | – | 510,924,245 | 510,924,245 | – | – | 510,924,245 | 510,924,245 |
| Financial assets measured at fair value through other | ||||||||
| comprehensive income- Loans and advances to customers | – | 4,619,866 | – | 4,619,866 | – | 4,619,866 | – | 4,619,866 |
| Financial assets at amortised cost – Debt and other instruments Financial assets measured at fair value through other | – | – | 114,795,690 | 114,795,690 | – | – | 114,804,987 | 114,804,987 |
| comprehensive income | – | 124,552,817 | – | 124,552,817 | – | 124,552,817 | – | 124,552,817 |
| Other assets | – | – | 6,198,600 | 6,198,600 | – | – | 6,373,793 | 6,373,793 |
| Total financial assets | 17,509,006 | 129,172,683 | 695,085,417 | 841,767,106 | 17,509,006 | 129,172,683 | 695,303,770 | 841,985,459 |
| Financial Liabilities | ||||||||
| Due to banks | – | – | 12,372,311 | 12,372,311 | – | – | 12,372,311 | 12,372,311 |
| Derivative financial liabilities | 201,000 | – | – | 201,000 | 201,000 | – | – | 201,000 |
| Financial liabilities at amortised cost -Due to depositors | – | – | 564,758,931 | 564,758,931 | – | – | 563,905,482 | 563,905,482 |
| Financial liabilities at amortised cost – Due to other borrowers | – | – | 134,354,757 | 134,354,757 | – | – | 134,363,917 | 134,363,917 |
| Debt securities issued | – | – | 12,286,859 | 12,286,859 | – | – | 12,286,859 | 12,286,859 |
| Other liabilities and provisions | – | – | 8,298,358 | 8,298,358 | – | – | 8,609,098 | 8,609,098 |
| Subordinated term debt | – | – | 9,363,299 | 9,363,299 | – | – | 9,363,299 | 9,363,299 |
| Total financial liabilities | 201,000 | – | 741,434,515 | 741,635,515 | 201,000 | – | 740,900,966 | 741,101,966 |
Fair Values of Financial Instruments
Financial Instruments Recorded at Fair Value
The following is a description of how fair values are determined for financial instruments that are recorded at fair value using valuation techniques. These incorporate the Bank’s estimate of assumptions that a market participant would make when valuing the instruments.
- Derivatives
Derivative products valued with market-observable inputs are mainly currency swaps and forward foreign exchange contracts. Such valuations incorporate various inputs such as foreign exchange spot and forward rates.
- Financial Assets at Fair Value through Other Comprehensive Income
Financial Assets at Fair Value through Other Comprehensive Income are valued using valuation techniques or pricing models primarily consisted of unquoted equities.
- Financial Assets at Fair Value through Profit or Loss
Quoted Equities and Sri Lanka Government Securities – are included under Financial Assets at Fair Value through Profit or Loss are valued using market prices.
Determination of Fair Value and Fair Value Hierarchy
The Bank uses the following hierarchy for determining and disclosing the fair value of financial instruments by valuation technique.
Level 1: Quoted (unadjusted) prices in active markets for identical assets or liabilities.
Level 2: Other techniques for which all inputs which have a significant effect on the recorded fair value are observable, either directly or indirectly.
Level 3: Techniques which use inputs that have a significant effect on the recorded fair value that are not based on observable market data.
The following table shows an analysis of financial instruments and non financial assets and liabilities recorded at fair value by level of fair value hierarchy
| As at 31 March 2026 Level 1 | Level 2 | Level 3 | Total | |||
| LKR 000 | LKR 000 | LKR 000 | LKR 000 | |||
| Financial Assets | ||||||
| Derivative financial assets | ||||||
| Forward foreign exchange contracts | – | 8,263,904 | – | 8,263,904 | ||
| Financial assets measured at fair value through profit or loss | ||||||
| Government of Sri Lanka Treasury Bills
and Bonds |
7,243,499 | – | – | 7,243,499 | ||
| Equity securities – quoted | 4,723,511 | – | – | 4,723,511 | ||
| Units in unit trusts – unquoted | – | 65,065 | – | 65,065 | ||
| Financial assets measured at fair value through | ||||||
| other comprehensive income
Loans and advances to customers |
– | 4,795,290 | – | 4,795,290 | ||
| Government of Sri Lanka Treasury Bills
and Bonds |
89,392,078 | – | – | 89,392,078 | ||
| US Treasury Bill | 965,844 | – | – | 965,844 | ||
| Debentures | – | 1,221,280 | – | 1,221,280 | ||
| Equity shares- quoted | 31,450,971 | – | – | 31,450,971 | ||
| Equity shares- unquoted | – | – | 394,460 | 394,460 | ||
| 133,775,903 | 14,345,539 | 394,460 | 148,515,902 | |||
| Financial Liabilities | ||||||
| Derivative financial liabilities | ||||||
| Forward foreign exchange contracts | – | 521,313 | – | 521,313 | ||
| – | 521,313 | – | 521,313 | |||
| As at 31 December 2025 | Level 1 | Level 2 | Level 3 | Total | ||
| LKR 000 | LKR 000 | LKR 000 | LKR 000 | |||
| Financial Assets | ||||||
| Derivative financial assets | ||||||
| Forward foreign exchange contracts | – | 8,494,001 | – | 8,494,001 | ||
| Financial assets measured at fair value through profit or loss | ||||||
| Government of Sri Lanka Treasury Bills
and Bonds |
2,821,037 | – | – | 2,821,037 | ||
| Equity securities – quoted | 3,789,656 | – | – | 3,789,656 | ||
| Units in unit trusts – unquoted | – | 2,404,312 | – | 2,404,312 | ||
| Financial assets measured at fair value through | ||||||
| other comprehensive income
Loans and advances to customers |
– | 4,619,866 | – | 4,619,866 | ||
| Government of Sri Lanka Treasury Bills
and Bonds |
89,724,485 | – | – | 89,724,485 | ||
| US Treasury Bond | 1,569,429 | – | – | 1,569,429 | ||
| Debentures | – | 1,714,175 | 1,714,175 | |||
| Equity shares- quoted | 31,212,665 | – | – | 31,212,665 | ||
| Equity shares- unquoted | – | – | 332,063 | 332,063 | ||
| 129,117,272 | 17,232,354 | 332,063 | 146,681,689 | |||
| Financial Liabilities | ||||||
| Derivative financial liabilities | ||||||
| Forward foreign exchange contracts | – | 201,000 | – | 201,000 | ||
| – | 201,000 | – | 201,000 | |||
Set out below is a comparison, by class, of the carrying amounts and fair values of the Bank’s financial instruments that are not carried at fair value in the financial statements. This table does not include the fair values of non-financial assets and non-financial liabilities.
| As at 31 March 2026 | As at 31 December 2025 | |||
| Carrying Amount | Fair Value | Carrying Amount | Fair Value | |
| Financial Assets | ||||
| Cash and cash equivalents | 18,889,782 | 18,889,782 | 22,771,091 | 22,771,091 |
| Balances with Central Bank of Sri Lanka | 5,341,762 | 5,341,762 | 2,952,879 | 2,952,879 |
| Placements with banks | 26,505,202 | 26,505,202 | 37,442,912 | 37,442,912 |
| Financial assets at amortised cost – Loans and
advances to customers |
535,694,978 | 500,425,534 | 510,924,245 | 477,425,470 |
| Financial assets at amortised cost – Debt and other
instruments |
119,395,598 | 120,914,167 | 114,795,690 | 116,567,539 |
| Other financial assets | 11,983,220 | 11,983,220 | 6,198,600 | 6,198,600 |
| Financial Liabilities | ||||
| Due to banks | 5,835,836 | 5,835,836 | 12,372,311 | 12,372,311 |
| Financial liabilities at amortised cost – due to
depositors |
604,292,760 | 603,587,712 | 564,758,931 | 566,423,213 |
| Financial liabilities at amortised cost – due to other
borrowers |
117,449,024 | 117,449,024 | 134,354,757 | 134,354,757 |
| Debt securities issued | 10,009,828 | 10,163,533 | 12,286,859 | 12,614,066 |
| Other financial liabilities | 11,331,398 | 11,331,398 | 8,298,358 | 8,298,358 |
| Subordinated term debt | 18,544,595 | 19,419,045 | 9,363,299 | 10,343,084 |
Fair Value of Financial Assets and Liabilities not Carried at Fair Value
The following describes the methodologies and assumptions used to determine fair values for those financial instruments which are not already recorded at fair value in the Financial Statements.
Assets for which Fair Value Approximates Carrying Value
For financial assets and financial liabilities that have a short term maturity, it is assumed that the carrying amounts approximate their fair value. This assumption is applied for Cash and Cash Equivalents, Balances with Central Bank of Sri Lanka, Placements with Banks and Securities Purchased under Re-sale Agreements. This assumption is also applied to demand deposits, savings accounts without a specific maturity, floating rate instruments and fixed rate instruments having maturities within 12 months.
Fixed Rate Financial Instruments
The fair value of fixed rate financial assets and liabilities (other than assets and liabilities with maturities within 12 months) carried at amortised cost are estimated by comparing market interest rates when they were first recognised with current market rates for similar financial instruments.
Reconciliation of Level 3 fair values
The following table shows a reconciliation from the opening balances to the closing balances for Level 3 fair values.
| Equity Securities | ||
| Bank/Group | ||
| 2026
LKR 000 |
2025
LKR 000 |
|
| Balance at 1 January | 332,063 | 270,193 |
| Purchased during the period | ||
| Gain included in OCI | ||
| – Net change in fair value (unrealised) | – | 61,870 |
| Balance at end of the period | 332,063 | 332,063 |
Sensitivity analysis
| OCI Net of Tax | ||
| Equity securities as at 31.03.2026 | Increase
LKR 000 |
Decrease
LKR 000 |
| Adjusted net assets value (5% movement) | 16,603 | (16,603) |
For the fair values of equity securities, reasonably possible changes at the reporting date to one of the significant unobservable inputs, holding other inputs constant, would have the following effects.
OPERATING SEGMENTS – GROUP
Information about reportable segments
|
For the period ended 31 March |
Corporate Banking | Retail Banking & SME | Treasury | Other | Unallocated | Total | ||||||
| 2026 | 2025 | 2026 | 2025 | 2026 | 2025 | 2026 | 2025 | 2026 | 2025 | 2026 | 2025 | |
| LKR 000 | LKR 000 | LKR 000 | LKR 000 | LKR 000 | LKR 000 | LKR 000 | LKR 000 | LKR 000 | LKR 000 | LKR 000 | LKR 000 | |
| Net interest income – external customers | 2,594,087 | 2,485,522 | 1,403,114 | (313,563) | 4,944,606 | 6,180,889 | 18,051 | 18,766 | (618,687) | (943,637) | 8,341,171 | 7,427,977 |
| Inter-segment net interest income | (1,744,115) | (1,804,971) | 2,673,377 | 3,497,534 | (2,731,621) | (3,638,192) | – | – | 1,802,359 | 1,945,629 | – | – |
| Total net interest income | 849,972 | 680,551 | 4,076,491 | 3,183,971 | 2,212,985 | 2,542,697 | 18,051 | 18,766 | 1,183,672 | 1,001,992 | 8,341,171 | 7,427,977 |
| Net fee and commission income | 481,445 | 382,653 | 1,414,268 | 990,581 | 17,385 | (2,314) | (193) | (194) | 3,022 | 63,436 | 1,915,927 | 1,434,162 |
| Net gains from trading | 40,024 | 50,704 | 86,462 | 43,766 | (562,909) | (7,321) | – | – | – | – | (436,423) | 87,149 |
| Net gains from derecognition of financial assets | – | – | – | – | 678,321 | 683,870 | – | – | – | – | 678,321 | 683,870 |
| Net other operating income | 1,779 | (813) | (10,220) | (6,028) | 14,814 | – | 209,305 | 200,386 | 1,374,486 | 1,255,675 | 1,590,164 | 1,449,220 |
| Total operating income | 1,373,220 | 1,113,095 | 5,567,001 | 4,212,290 | 2,360,596 | 3,216,932 | 227,163 | 218,958 | 2,561,180 | 2,321,103 | 12,089,160 | 11,082,378 |
| Impairment for loans and other losses | (1,614,591) | (566,847) | (1,046,801) | 382,942 | (63,196) | (112,632) | – | – | (438,444) | (1,058,416) | (3,163,032) | (1,354,953) |
| Net operating income/ Segment Result | (241,371) | 546,248 | 4,520,200 | 4,595,232 | 2,297,400 | 3,104,300 | 227,163 | 218,958 | 2,122,736 | 1,262,687 | 8,926,128 | 9,727,425 |
| Operating profit after taxes on financial services | 2,574,174 | 4,104,722 | ||||||||||
| Share of (loss)/ profit of associate | (1,251) | 206 | ||||||||||
| Profit for the period from discontinued operations | – | 116,274 | ||||||||||
| Income tax expense | (760,872) | (1,178,364) | ||||||||||
| Non-controlling interest | 43,260 | 50,490 | ||||||||||
| Net profit for the period, attributable to equity holders of the Bank | 1,768,791 | 2,992,348 | ||||||||||
| As at 31 March | 2026 | 2025 | 2026 | 2025 | 2026 | 2025 | 2026 | 2025 | 2026 | 2025 | 2026 | 2025 |
| LKR 000 | LKR 000 | LKR 000 | LKR 000 | LKR 000 | LKR 000 | LKR 000 | LKR 000 | LKR 000 | LKR 000 | LKR 000 | LKR 000 | |
| Segment assets | 214,184,911 | 159,643,687 | 324,825,718 | 255,491,429 | 295,511,926 | 305,709,753 | 1,586,802 | 1,252,019 | 49,039,273 | 42,594,703 | 885,148,629 | 764,691,592 |
| Segment liabilities | 144,288,266 | 94,785,698 | 459,910,119 | 406,169,117 | 152,331,550 | 152,010,894 | 878,983 | 704,503 | 19,290,999 | 19,449,902 | 776,699,917 | 673,120,114 |
| For the period ended 31 March
Information on cash flows |
2026 | 2025 | 2026 | 2025 | 2026 | 2025 | 2026 | 2025 | 2026 | 2025 | 2026 | 2025 |
| LKR 000 | LKR 000 | LKR 000 | LKR 000 | LKR 000 | LKR 000 | LKR 000 | LKR 000 | LKR 000 | LKR 000 | LKR 000 | LKR 000 | |
| Cash flows from operating activities Cash flows from investing activities
Cash flows from financing activities |
–
– – |
–
– – |
–
– – |
–
– – |
–
– – |
–
– – |
–
– – |
–
– – |
–
– – |
–
– – |
5,575,915
(3,285,329) (17,083,753) |
7,954,435
494,690 13,922,202 |
| Net cash flows generated during the period | – | – | – | – | – | – | – | – | (14,793,167) | 22,371,327 | ||
| Capital expenditure: Property, plant and equipment Intangible assets |
–
– |
–
– |
–
– |
–
– |
–
– |
–
– |
33,102
34,511 |
166,123
136,439 |
–
– |
–
– |
33,102
34,511 |
166,123
136,439 |
| Total capital expenditure | – | – | – | – | – | – | 67,613 | 302,562 | – | – | 67,613 | 302,562 |